Know the street
before you go.
See where people walking, cycling and riding keep getting hit, what usually goes wrong at each spot, and what to watch for. Built from 114,956 reported crashes, 2021–2025.

Find the car-free way.
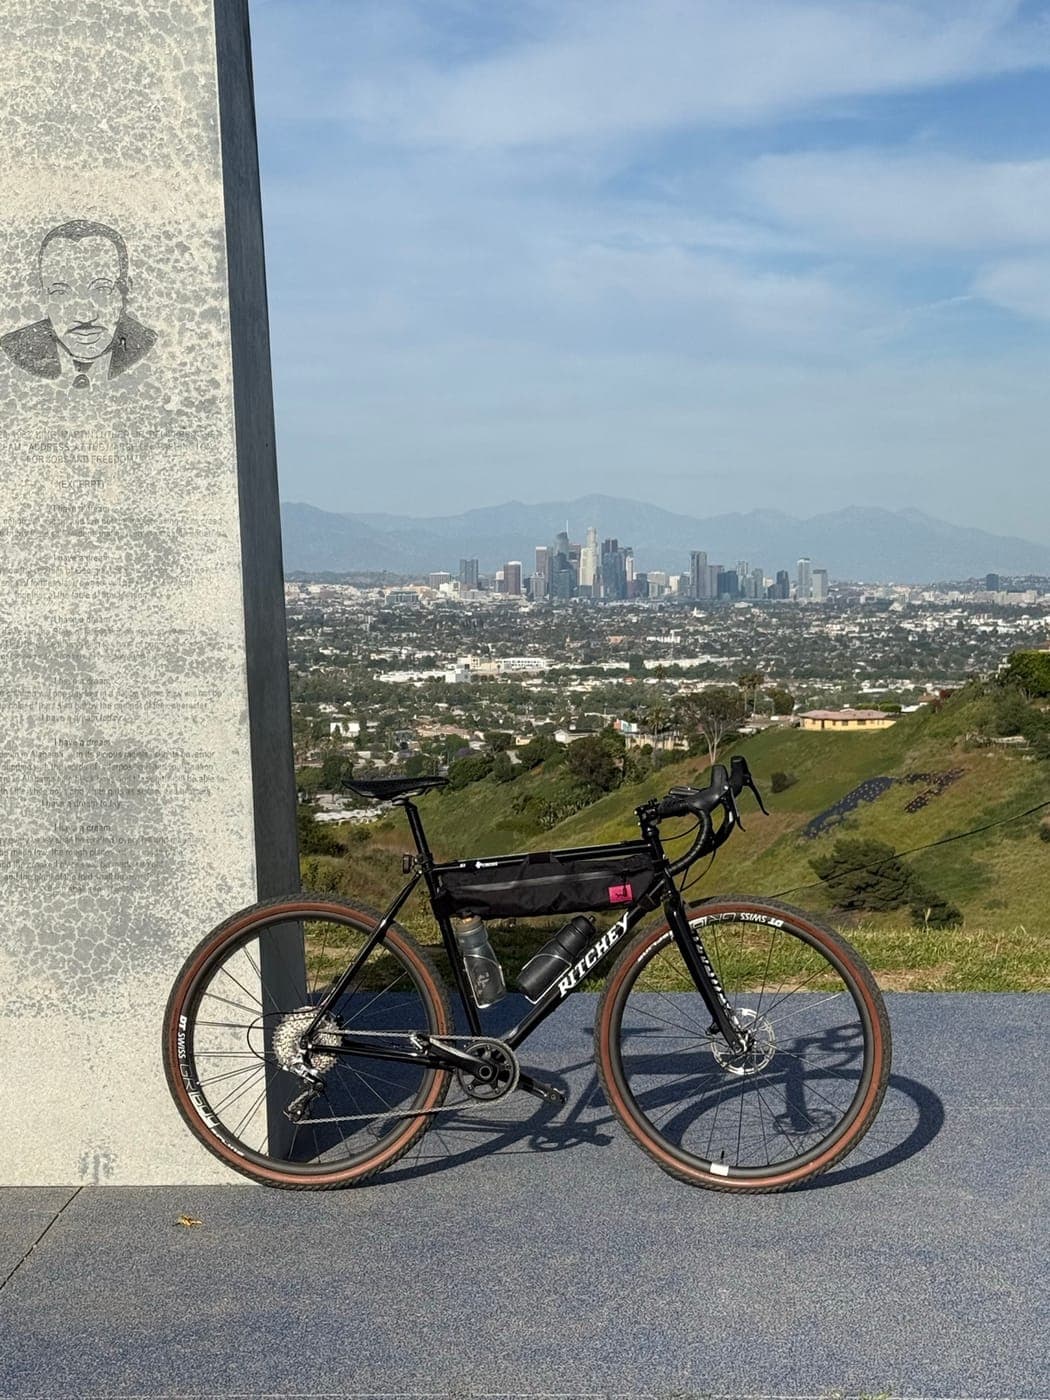
See every bike path and gravel road around you, which streets have bike lanes, and which busy roads to avoid, with advice for the known trouble spots.
- Bike paths and 21 reviewed Safe Haven corridors, away from cars.
- Gravel and dirt roads, with surface grade and access tips.
- Blue streets have a bike lane; grey roads are busy with none.
- 30,133 bike crashes reported 2021–2025, as a heatmap and tap-for-detail dots.
Cross with your eyes open.
Nearly 4 in 10 people hit on foot were in a crosswalk at the intersection. This map shows the crossings near you where people keep getting hit, what drivers were doing, and what to watch for.
- Crash hotspots near you, each explained: turning drivers, mid-block crossings, after-dark crashes.
- Footpaths and pedestrian streets away from cars.
- Busy roads to cross at a signal.
- 35,599 pedestrian crashes reported 2021–2025.

Spot the stroads.
The crash that catches riders out most is a car turning left across their path. This map flags the fast, wide roads where that keeps happening, like Olympic, Crenshaw and Sepulveda.
- Stroads: about 3,500 miles of 35+ mph, multi-lane roads with frequent left-turn junctions.
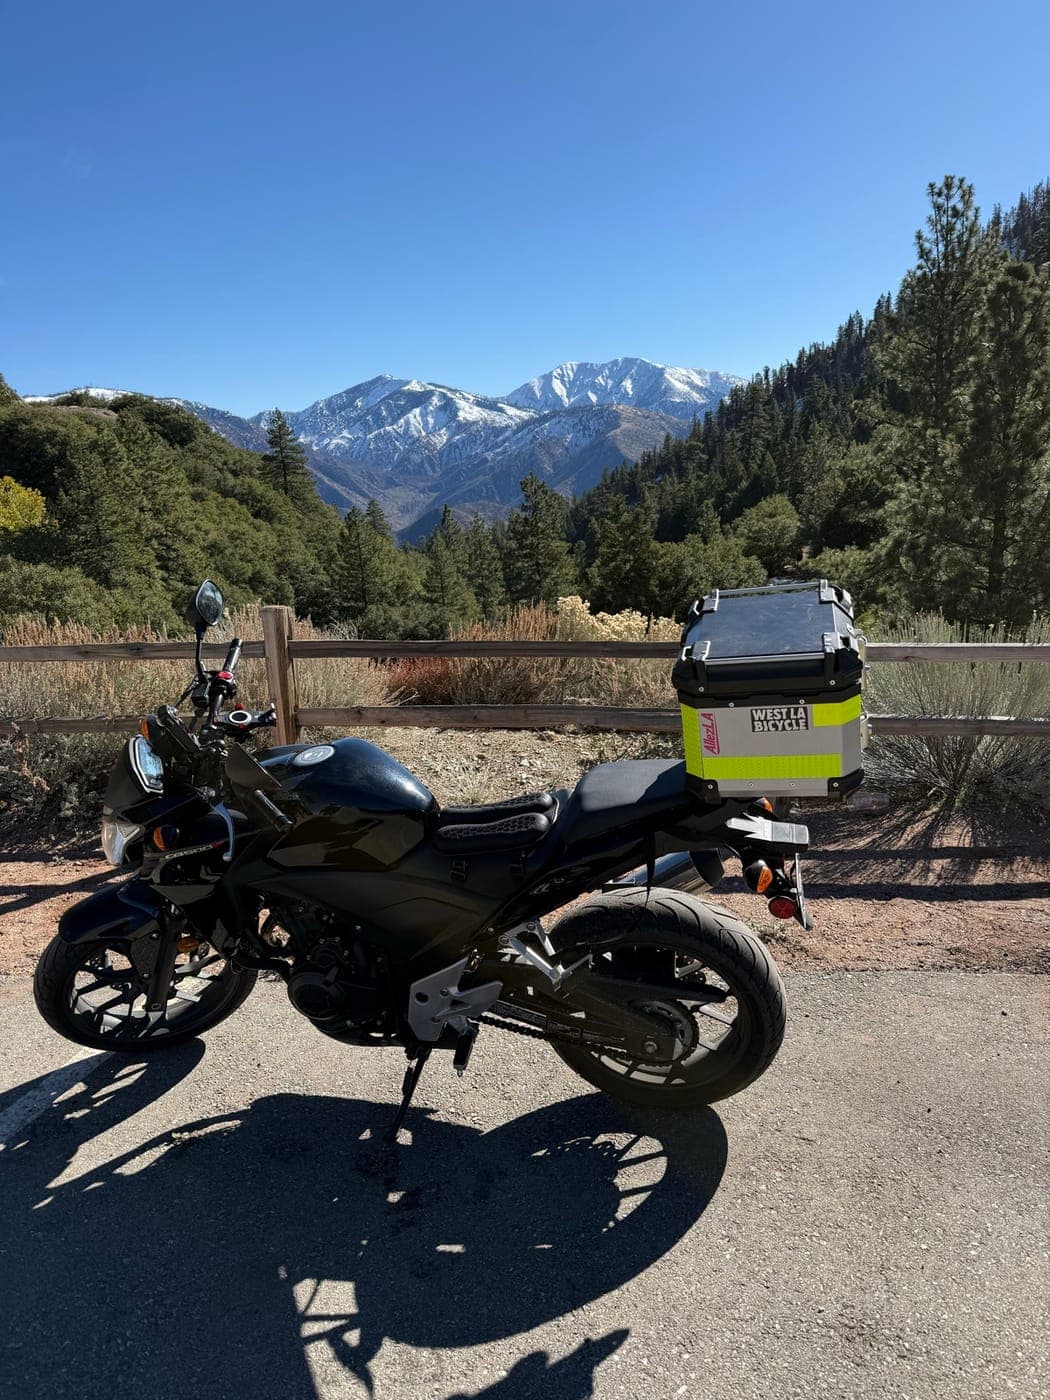
- Crash-prone stretches where motorcycle crashes repeat, with how riders crash there.
- 17 classic riding roads, from Angeles Crest to Highway 36, with what to watch for.
- 49,224 motorcycle crashes reported 2021–2025.

Practise the ride first.
Ride real California roads in 3D, built from real elevation and road geometry, before you ride them for real.
- Mulholland "The Snake", Highway 1 through Big Sur and Angeles Crest, plus a parking-lot training range.
- Countersteering, trail braking, a six-speed gearbox and real engine sound.
- Cockpit and chase views, and day, sunset and night riding.
Look up your city.
Every city page ranks the spots where crashes keep happening and says what usually goes wrong at each one. Numbers are reported crashes, 2021–2025.
Most reported pedestrian crashes
- 1Long Beach919
- 2Fresno900
- 3Bakersfield745
- 4Santa Ana700
- 5Stockton641
- 6Modesto524
- 7Los Angeles498
- 8San Jose433
- 9San Bernardino420
- 10Anaheim368
- 11Berkeley364
- 12Riverside353
Most reported bike crashes
- 1Huntington Beach798
- 2Santa Ana740
- 3Long Beach648
- 4Stockton582
- 5Santa Barbara531
- 6Fresno498
- 7Carlsbad460
- 8Berkeley458
- 9Bakersfield438
- 10Modesto420
- 11Newport Beach398
- 12Costa Mesa361
Honest about the data.
Crashes
From the California Crash Reporting System. Many city police reports have no location, so cities like Los Angeles are undercounted, and busy roads show more crashes partly because more people ride them. We say so on every map.
Roads
Bike paths, lanes, speed limits and junctions come from OpenStreetMap. Stroads are flagged from how the road is built, not from crash counts, so they show up even where crash reports are missing.